

A high-revenue sales channel can still produce little profit once its costs are included. To understand how to calculate channel profitability, start with channel revenue, then subtract cost of goods sold, channel-specific costs, allocated demand generation, and channel conflict opportunity cost. The result shows more than sales volume: it reveals what each route to market contributes after the costs tied to it.
That calculation is only as reliable as the data behind it. Gather sales, discounts, fulfillment, advertising, returns, and other channel expenses for the same reporting period, then use a clear method to allocate shared overhead. Calculate profit at each contribution margin level to see how the result changes as you include more costs. This guide explains how to organize comparable channel data, calculate profitability, and use the results to assess channel performance and investment.
Key Takeaways
- Bring sales, discounts, marketing, and cost data together by channel so profitability comparisons use a consistent foundation.
- Include channel-specific fees, fulfillment, advertising, and returns to see what each sales route costs to operate.
- Allocate shared overhead using a consistent method, then track how those expenses affect contribution margins.
- Compare CM1, CM2, CM3, and fully loaded profit to distinguish direct performance from results after broader costs.
- Use a structured channel profit calculation to support clearer decisions about channel investment and partner programs.
Collecting sales, discounts, costs, and marketing data
Build channel comparisons from matched sales, cost, and marketing records. Review results at each regular reporting close, and when pricing or return patterns change. Use internal targets and historical results as benchmarks, since one margin target won’t fit every channel. To learn how to calculate channel profitability, start by keeping each channel’s inputs distinct.
- Start with sales records. Capture revenue, order volume, units, discounts, and returns by channel and reporting period. Keep gross sales separate from discounts and refunds, so net revenue remains visible. For example, a SaaS affiliate program example uses $200,000 in monthly revenue and 2,000 attributed orders over a 30-day reporting period. Consistent fields make later comparisons more useful.
- Connect costs to the same sales records. Include cost of goods sold, partner commissions, incentive payments, and channel-specific marketing expenses. Record rebates separately from standard discounts because they can affect realized margin differently. If partners earn rebates for meeting sales targets, track qualifying sales and rebates by channel and reporting period.
- Separate marketing channels before assessing return. Group spend and attributed sales by source, then apply one attribution method consistently. Calculate channel CAC by dividing that channel’s acquisition spend by its acquired customers. Compare CAC with gross margin and customer revenue, not revenue alone. A DTC example combines a 70% gross margin, $40 CAC, and $50 price, yet remains barely profitable.
- Include marketplace charges and post-sale adjustments. Marketplace commissions typically run 15-30% of revenue, so record the actual commission against marketplace sales. Add fulfillment charges, advertising, refunds, and return-related costs where applicable. A returned order can reduce recognized revenue while leaving some acquisition or processing costs behind. Keep those effects visible instead of blending them into general expenses.
- Use the same review schedule and comparison rules across channels. At each regular financial close, compare actual sales, discount rates, return costs, customer acquisition costs, and margins with channel targets and prior results. Investigate changes by cost driver, such as higher commissions or increased returns. When deciding how to calculate channel profitability, use benchmarks to identify changes, then assess whether the channel’s economics support the business.
Channel-specific fees, fulfillment, advertising, and return costs
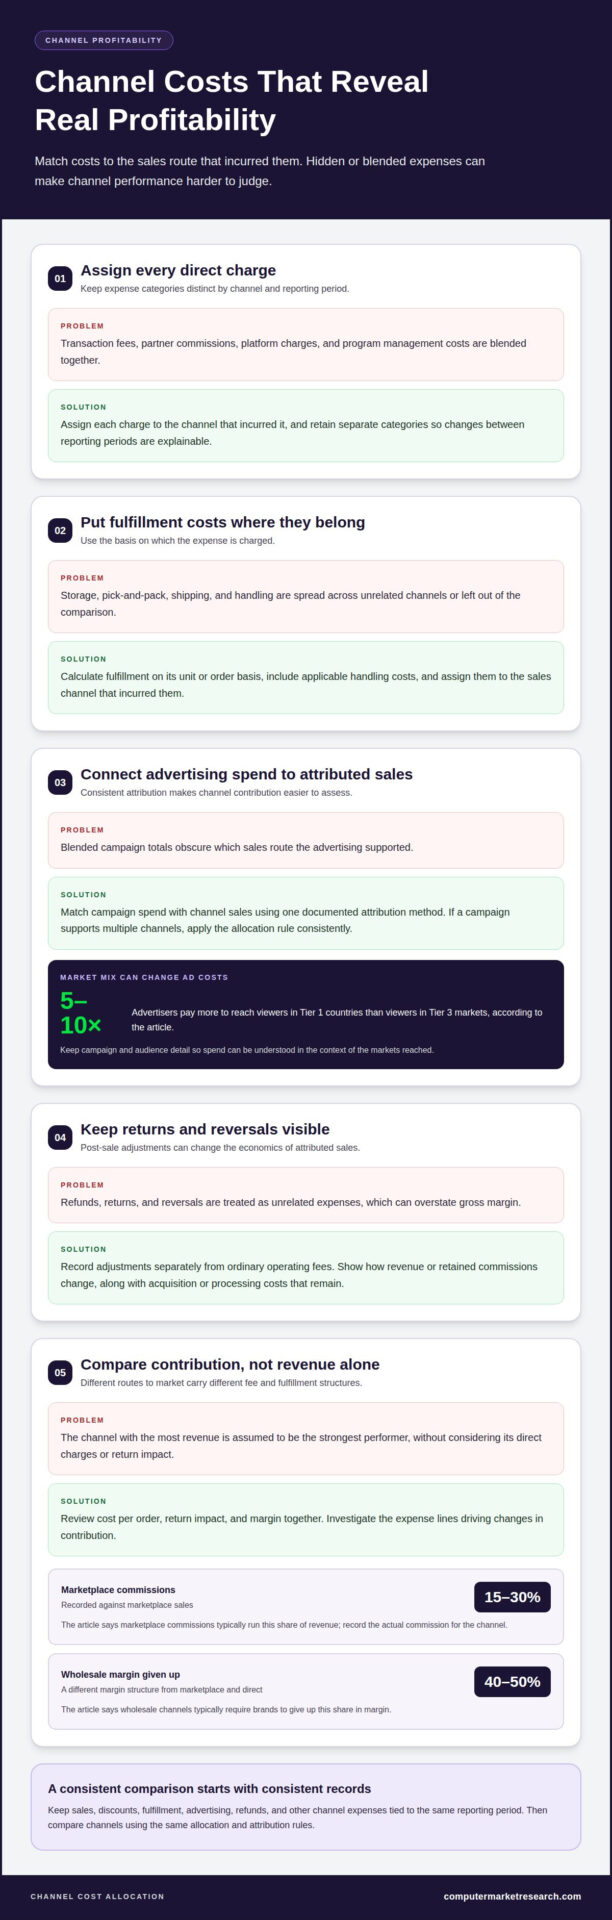
- Assign each charge to the channel that incurred it. Separate transaction fees, partner commissions, platform charges, fulfillment, and program management costs. Keeping categories distinct helps explain why channel expenses change between reporting periods.
- Calculate fulfillment costs using the unit or order basis on which they are charged. Include storage, pick-and-pack, shipping, and other handling expenses when applicable. Assign costs to the sales channel that incurred them, rather than spreading them across unrelated channels.
- Attribute advertising expense to the revenue it supports. Match campaign spend with channel sales using a consistent attribution method, then subtract that spend when assessing channel contribution. If a campaign supports both direct and marketplace sales, document the allocation rule and apply it consistently. Accurate attribution helps you assess channel performance rather than relying on blended marketing results.
- Record refunds, returns, and reversals separately from ordinary operating fees. These adjustments affect revenue or commissions retained from attributed sales. Keep them visible in reporting so gross margin isn’t overstated by treating reversals as unrelated costs.
- Compare channel economics after all direct charges are assigned. Wholesale channels typically require brands to give up 40-50% in margin, while marketplace and direct channels have different fee and fulfillment structures. Don’t assume the channel with the most revenue produces the strongest contribution. Review cost per order, return impact, and margin together, then investigate the expense lines driving any change.
Geography can also change the advertising cost assigned to a channel. The page states that advertisers pay 5-10× more to reach viewers in Tier 1 countries than viewers in Tier 3 markets. When campaign audiences span both, retain enough campaign and audience detail to understand which markets the spend reached, rather than treating the campaign total as a uniform cost. This distinction is useful when comparing contribution across channels whose customers may be concentrated in different markets. It also helps explain why similar sales outcomes can have different advertising burdens. Keep the comparison tied to the campaign’s actual targeting and the sales attribution rule already used for that channel.
When reviewing results, consider whether higher spend reflects the market mix, campaign targeting, or a change in performance. Don’t treat a higher cost to reach viewers as proof that a channel is less efficient; compare attributed revenue and related costs together. If spending supports multiple channels, document how it is assigned and apply the same method in future reports. Separating market-level advertising detail from channel totals makes cost changes easier to interpret and keeps channel contribution grounded in the costs that supported its sales.
Shared overhead allocation
Separate direct channel costs from shared overhead before comparing fully loaded results. Apply one allocation strategy consistently so channel performance reflects expenses, not arbitrary accounting choices.
- Define the shared expense pool. Group costs that support several channels, such as finance, general administration, and shared technology. Keep directly traceable expenses assigned to their channel. For example, a campaign serving one channel belongs there, while a shared reporting system may need allocation. This distinction prevents direct costs from being counted twice.
- Choose an allocation driver for each expense. Match the driver to how the cost is used. Revenue may suit some administrative costs, while transaction volume may better reflect processing workload. Headcount or support hours can help allocate labor expenses. Document your reasoning so consistent treatment supports comparisons across periods.
- Apply the method to the full expense pool. A worked example uses $20,000 in general expenses. To allocate that pool, calculate each channel’s share using the chosen driver, then multiply the share by $20,000. Record the calculation and retain the unallocated total as a reconciliation check. The channel allocations should add back to the pool.
- Avoid equal splits without a cost basis. Dividing overhead evenly can distort results when channels differ in revenue, activity, or support needs. For example, a low-volume channel may use fewer transaction-processing resources than a high-volume channel. Use an equal allocation only when it reasonably represents how the shared expense benefits or supports each channel.
- Keep the allocation rule stable and review exceptions. Apply the same driver across reporting periods, then explain any change in method. Companies expanding from one sales channel to five typically add 3-5% to OPEX in complexity costs alone. That growth makes traceable assumptions important: otherwise, overhead shifts can look like changes in channel performance.
- Show both contribution and allocated results. Report channel profit before shared overhead alongside profit after allocation. The first view shows economics tied directly to the channel; the second shows its share of company-wide expenses. If a channel’s fully loaded result changes, trace the difference to its direct costs, allocation driver, or overhead pool before adjusting strategy.
CM1, CM2, CM3, and fully loaded channel profit
Track actual contribution margins beside targets to see how each channel’s profit changes. Common mistakes include omitting costs and mixing reporting periods. The UK Government identifies omitted front-line staff costs as a profitability measurement error.
-
Calculate Contribution Margin Levels
Calculate each margin in sequence, adding costs at each level. Treat CM1 as revenue minus cost of goods sold, showing product economics before channel expenses. CM2 subtracts direct channel costs, such as commissions, fulfillment, and advertising. CM3 also includes other directly attributable operating expenses. Fully loaded channel profit then subtracts the channel’s allocated share of shared overhead.
Use the same definitions every month. Labels can vary across businesses, so document which expenses each level includes. The comparison example gives B2B SaaS an 80% gross margin, while DTC ecommerce has a 45% gross margin and $30,000 in true contribution profit. Gross margin alone therefore doesn’t show the full channel contribution.
Track actual CM1, CM2, and CM3 against targets in one monthly view. If CM1 holds steady but CM2 falls, investigate channel-specific expenses. If CM3 declines instead, review directly attributable operating costs. Compare fully loaded profit separately, since overhead allocation can change the final view without changing direct channel economics.
-
Check for Measurement Mistakes
Audit each margin level for omitted or duplicated expenses. The UK Government identifies leaving out front-line staff as a profitability measurement mistake. Confirm staff costs are included at the appropriate level, and that costs assigned directly to a channel don’t also appear in shared overhead.
Keep actual results distinct from targets and use consistent periods. Comparing a monthly channel result with a different reporting period can distort analysis. Also avoid treating gross margin as channel profit: it excludes later cost layers. A product’s apparent 40% margin can fall to 32% after landed costs are allocated.
When results shift, trace the change through CM1, CM2, CM3, and fully loaded profit. A channel with $2M in revenue and $1.9M in total costs illustrates why sales volume alone can mislead. Review the cost layer that moved, then assess whether the target still reflects the channel’s role and economics.
Channel profit formula and calculation steps
- Set the reporting period and channel. Choose one channel and a consistent period before calculating. This keeps revenue and expenses aligned, so the result measures the same activity. For monthly reporting, include sales and costs recorded in that month, applying consistent timing rules to refunds and adjustments.
- Start with channel revenue. Use net revenue after discounts, refunds, and other sales adjustments. Then subtract channel cost of goods sold (COGS) to calculate gross profit. For example, $100,000 in sales minus $60,000 in inventory costs produces $40,000 in gross profit. This first result measures product economics before additional channel costs.
- Subtract direct channel expenses. Deduct costs tied specifically to generating or fulfilling that channel’s sales, such as commissions, fulfillment, advertising, and returns. Keep expense categories distinct. This produces contribution profit after direct channel costs, making it easier to identify which expenses are changing the result.
- Include allocated demand generation and conflict costs. Subtract the channel’s allocated demand-generation expense, then account for channel-conflict opportunity cost. The complete formula is: Channel profit = channel revenue − channel COGS − channel-specific costs − allocated demand generation − channel-conflict opportunity cost. Document the allocation method so metrics remain comparable across reporting periods.
- Calculate the margin and interpret the result. Divide channel profit by channel revenue, then multiply by 100 to express channel profit as a percentage. To see how to calculate channel profitability clearly, review the dollar result alongside the margin: one shows contribution size, while the other expresses profit relative to revenue. Compare both figures with targets and prior periods.
- Use the numbers to guide action. Trace changes through the formula’s cost layers before changing channel strategy. If revenue rises while profit falls, determine whether COGS, direct costs, demand generation, or conflict opportunity cost drove the difference. This step-by-step approach shows how to calculate channel profitability and connect decisions to the revenue and costs each channel produced.
Computer Market Research
Computer Market Research helps channel teams organize program data for profitability analysis. When partner activity, incentives, deal records, and sales information sit in separate workflows, it becomes harder to connect channel costs with results. Its channel management solutions support the operational processes that contribute data for performance reviews, while financial calculations remain grounded in your revenue and cost records.
PartnerPortal centralizes partner onboarding, deal registration, and performance tracking. This gives teams a clearer view of partner activity and its relationship to indirect sales and marketing operations. For channel profitability analysis, organized information can be used alongside financial records and consistent reporting definitions.
Program costs and partner incentives also affect channel results. Co-op/MDF Management supports the management of co-op and market development funds, while Rebates & Incentives supports incentive program processes. These offerings help teams organize program activity for analysis, including how funding and earned incentives relate to channel performance. Accurate profitability calculations still depend on assigning resulting expenses and revenue to the appropriate channels.
Deal Registration connects channel activity with sales records. Teams can use deal registration processes to track registered opportunities, then consider that activity alongside the revenue and costs included in profitability reporting. Together, these capabilities help organize operational inputs that might otherwise be fragmented across partner programs and sales workflows.
If manual tracking makes partner activity, program funds, or deal records difficult to reconcile with channel results, Computer Market Research’s channel management solutions can help organize those processes. Your financial definitions and allocation methods still determine how profitability is measured. Contact Computer Market Research to discuss your channel management needs.
Frequently Asked Questions
What Does Channel Profitability Mean for Your Brand?
Channel profitability shows how much each route to market contributes after its associated costs. For your business, the comparison can inform decisions about product availability, partner support, and investment priorities. A channel with strong sales may still tie up resources or create costs elsewhere in the distribution relationship. Reviewing profitability alongside strategic goals helps distinguish channels that generate revenue from those that contribute sustainable value.
What is channel profitability and what metrics should be included?
Channel profitability measures the financial contribution of a sales route after relevant costs. Useful metrics include net revenue, gross profit, contribution margin, fully loaded profit, customer acquisition cost, return rate, and inventory turnover where relevant. Choose metrics that fit the channel’s business model. For example, inventory turnover adds context when comparing products that sell at different rates, since margin alone doesn’t show how quickly stock moves.
What is the formula for calculating profit and profit margin by sales channel?
Calculate channel profit by subtracting channel COGS, channel-specific expenses, allocated demand generation, and channel-conflict opportunity cost from channel revenue. Calculate profit margin by dividing that channel profit by its revenue and multiplying by 100. Keep profit and margin side by side: the dollar result shows contribution size, while the percentage expresses profit relative to revenue. Use the same revenue and cost definitions for each channel comparison.
How do you allocate shared overhead and operating costs across channels?
Allocate shared overhead using a driver that reflects how each channel uses the resource. Revenue, order volume, support hours, or headcount may suit different expenses. For example, allocate transaction-processing costs by transaction activity, but shared staff costs by support hours. Record the selected driver and apply it consistently. Review the method when operations change so outdated allocations don’t distort channel comparisons.
Which direct and indirect costs should be included for each channel?
Include costs directly connected to channel activity, such as product costs, commissions, advertising, fulfillment, returns, and payment processing. Also account for indirect costs that support multiple channels, such as shared staff, technology, and administration. The UK Government identifies omitting front-line staff as a profitability measurement mistake. Classify each cost once, either directly or through a documented overhead allocation, to avoid omissions and double counting.
How should returns, discounts, payment fees, shipping, and fulfillment costs be accounted for?
Record discounts and refunds as reductions to the sales proceeds they affect, then assign payment fees, shipping, and fulfillment expenses to the related channel. Track returns separately from routine order costs because returned goods can affect recognized revenue, inventory, and handling expenses in different ways. Use transaction records to connect each adjustment with its original sale. This makes the channel’s realized revenue and expenses clearer than a blended company-wide total.
How do you compare profitability across ecommerce, retail, wholesale, and marketplace channels?
Compare each channel over the same reporting period, using consistent definitions for revenue, returns, and allocated costs. Then account for each route’s distinct economics: marketplace commissions, retail fulfillment and inventory, wholesale pricing and partner terms, or ecommerce acquisition and delivery expenses. Compare both profit dollars and margin, and interpret them alongside inventory movement and channel objectives. A shared method makes differences meaningful without assuming every channel has identical costs.
How do you calculate channel profitability using a spreadsheet or accounting data?
Organize records with one row per channel and reporting period, then add columns for net revenue, COGS, direct expenses, allocated overhead, and channel profit. Create formulas for profit and margin, and reconcile totals against accounting records. Use consistent channel labels across sales, expense, and returns data. A separate assumptions tab can document allocation drivers, attribution rules, and metric definitions, making monthly updates easier to audit and interpret.

Article by
Del Heles
Del Heles is the founder and CEO of Computer Market Research (CMR), a channel management software company he launched in 1984. With more than 40 years of experience, he’s known for helping manufacturers and distributors simplify complex partner programs through practical, customer-focused technology solutions.